
Cryptos
Cryptos

The general trend is down
The short trend is down
Time frame 4 hours
Bitcoin technical analysis03/03/2026
Bitcoin is trading in a general uptrend, while on the short-term 4-hour timeframe it is moving in a downtrend. Price climbed to the 109,000 level, where it was tested, before correcting lower to the 100,000 support level, which was broken to the downside. The decline extended to 92,000 and continued further to 74,000.
From 74,000, price rebounded toward the 77,000 resistance level, broke above it, and continued rising to 85,000, which was also breached to the upside along with a break of the descending trendline. The rally extended to 88,000, which was broken, and then continued higher, breaking above 109,000 and advancing to 119,000 resistance.
Price then corrected to 114,000 support, climbed again to 122,000, and pulled back to 112,000. After breaking below 112,000, it declined to 109,000, then rallied to 125,700, corrected to 121,000, and later dropped sharply to 60,000 before rebounding above 66,000.
Therefore, the positive outlook depends on price holding above the 66,000 support level, which would open the way for a move toward the 69,000 resistance level.
As for the negative outlook, a close below 66,000 would likely push prices down toward the 63,000 support level.

The general trend is down
The short trend is down
Time frame 4 hours
Bitcoin technical analysis02/03/2026
Bitcoin is trading in a general uptrend, while on the short-term 4-hour timeframe it is moving in a downtrend. Price climbed to the 109,000 level, where it was tested, before correcting lower to the 100,000 support level, which was broken to the downside. The decline extended to 92,000 and continued further to 74,000.
From 74,000, price rebounded toward the 77,000 resistance level, broke above it, and continued rising to 85,000, which was also breached to the upside along with a break of the descending trendline. The rally extended to 88,000, which was broken, and then continued higher toward 107,000 and above 109,000.
Price advanced to 119,000 resistance before correcting to 114,000 support, then climbed again to 122,000 and pulled back to 112,000. After breaking below 112,000, it declined to 109,000, then rallied to 125,700, corrected to 121,000, and later dropped sharply to 60,000 before rebounding above 66,000.
Therefore, the positive outlook depends on price holding above the 66,000 support level, which would open the way for a move toward the 69,000 resistance level.
As for the negative outlook, a close below 66,000 would likely push prices down toward the 63,000 support level.

The general trend is down
The short trend is down
Time frame 4 hours
Bitcoin technical analysis27/02/2026
Bitcoin is trading in a general uptrend, but on the short-term 4-hour timeframe it is in a downward trend. Price climbed to the 109,000 level, where it was tested before correcting lower to the 100,000 support level, which was broken to the downside. The decline extended to 92,000 support and continued down to 74,000.
From 74,000, price rebounded to the 77,000 resistance level, broke above it, and continued rising to 85,000 resistance, which was also breached to the upside along with a breakout of the descending trendline. The rally extended to 88,000 resistance, which was broken, followed by further gains toward 107,000, which was also surpassed, in addition to a breakout above 109,000.
Price then climbed to the 119,000 resistance level and corrected to 114,000 support. It rebounded to 122,000 resistance, then corrected to 112,000, which was broken down to 109,000. After that, Bitcoin surged to 125,700, corrected to 121,000, then declined sharply to the 60,000 support level before rebounding above 68,000.
Therefore, the positive outlook remains valid as long as price holds above the 68,000 support level, targeting a move toward the 71,000 resistance level.
The negative outlook would be a close below 68,000, which could push prices down to the 65,000 support level.

The general trend is down
The short trend is down
Time frame 4 hours
Bitcoin technical analysis25/02/2026
Bitcoin is trading in a general uptrend, but on the short-term 4-hour timeframe it has been moving in a downtrend. Price climbed to the 109,000 level, where it was tested, before correcting lower to the 100,000 support level, which was broken to the downside. The decline continued to 92,000 and extended further to 74,000.
From 74,000, price rebounded to the 77,000 resistance level, broke above it, and continued rising to 85,000, which was also breached to the upside along with a break of the descending trendline. The rally extended to 88,000, which was broken, and then continued higher to 107,000, followed by a break above 109,000.
Price advanced to 119,000 resistance before correcting to 114,000 support, then climbed again to 122,000 and pulled back to 112,000. After breaking below 112,000, it declined to 109,000, then rallied to 125,700, corrected to 121,000, and later dropped sharply to 60,000 before rebounding above 65,000.
Therefore, the positive outlook depends on price holding above the 65,000 support level, which would open the way for a move toward the 68,000 resistance level.
As for the negative outlook, a close below 65,000 would likely lead to a decline toward the 63,000 support level.
The general trend is down
The short trend is down
Time frame 4 hours
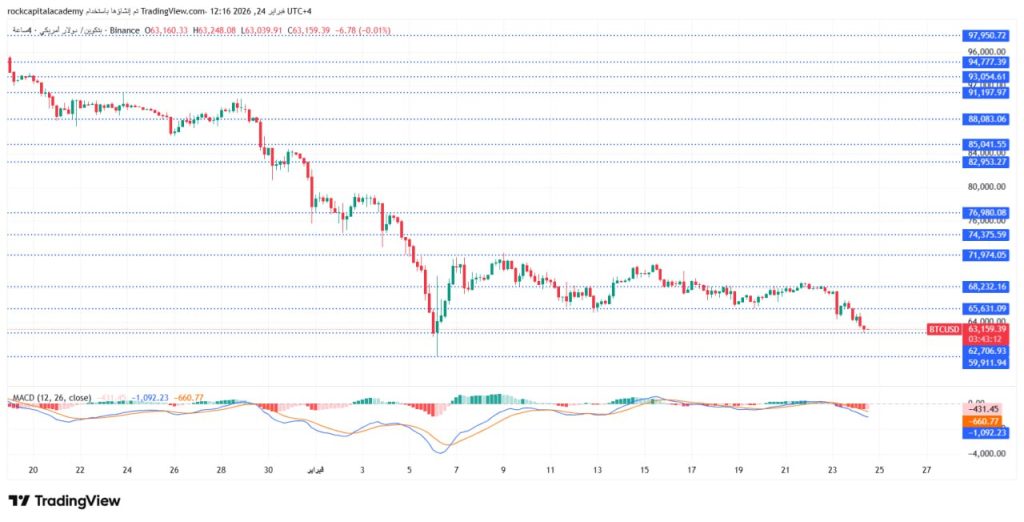
Bitcoin technical analysis24/02/2026
Bitcoin is trading in a general uptrend, while in the short term on the 4-hour timeframe it is moving in a downtrend.
Price climbed to the 109,000 level, where it was tested and followed by a correction to the downside toward the 100,000 support level, which was broken. The decline extended to the 92,000 support level and continued further down to 74,000. From there, price rebounded toward the 77,000 resistance level, broke above it, and continued rising to 85,000, which was also breached to the upside along with a breakout of the descending trendline.
The upward movement continued to 88,000 resistance, which was broken, then extended higher toward 107,000, which was also breached, followed by a break above 109,000. Price then rallied to the 119,000 resistance level, corrected to the 114,000 support level, and advanced again to 122,000 before correcting to 112,000. That level was broken to the downside, pushing price toward 109,000.
Afterward, Bitcoin rose to 125,700, corrected to 121,000, then declined sharply to the 60,000 support level before rebounding above 63,000.
Therefore, the positive outlook remains valid as long as price holds above the 63,000 support level, targeting a move to retest resistance.
On the other hand, the negative scenario would be confirmed by a close below 63,000, which could push prices down toward the 59,000 support level.

The general trend is down
The short trend is down
Time frame 4 hours
Bitcoin technical analysis23/02/2026
Bitcoin is trading in an overall uptrend, but in the short term on the 4-hour timeframe it is moving in a downtrend. The price climbed to the 109,000 level, where it was tested before correcting lower to the 100,000 support level, which was broken to the downside. The decline continued to 92,000 support and extended further to 74,000.
From 74,000, Bitcoin rebounded to the 77,000 resistance level, broke above it, and continued rising to 85,000, which was also breached. The upward move was supported by a breakout of the descending trendline. The rally extended to 88,000 resistance, which was broken, followed by further gains toward 107,000 resistance, which was also breached, along with a breakout above 109,000.
The price then climbed to 119,000 resistance and corrected to 114,000 support. From there, it rose to 122,000 before correcting to 112,000, which was broken to the downside toward 109,000. Bitcoin then advanced to 125,700, corrected to 121,000, and later declined sharply to the 60,000 support level before rebounding above 65,000.
Therefore, the bullish outlook remains valid as long as the price holds above the 65,000 support level, targeting a move toward the 69,000 resistance level.
On the other hand, the bearish scenario would be confirmed by a close below 65,000, which could push prices down toward the 60,000 support level.
